📊 K-mean Clustering For MSME Analysis Results
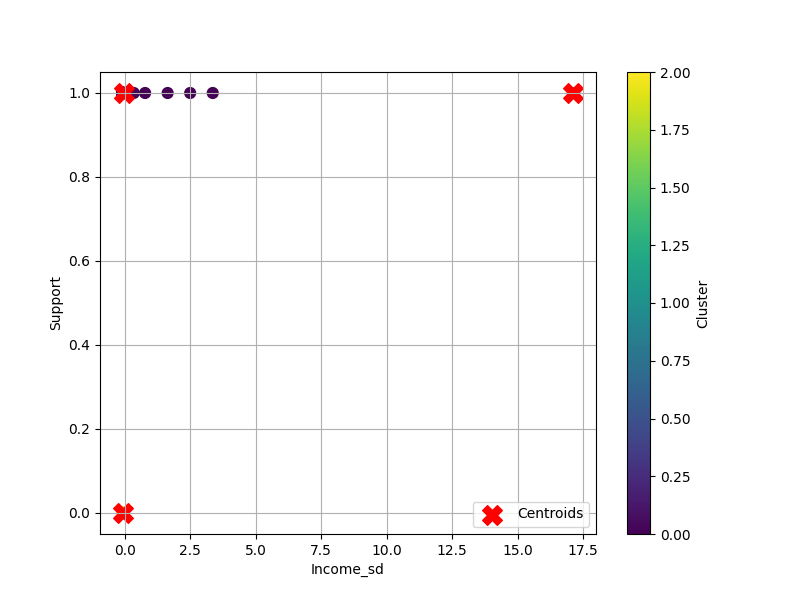
🎯 The center of each cluster
| Cluster |
Income_sd |
Support |
| 0 |
-0.046269 |
1.000000e+00 |
| 1 |
17.136089 |
1.000000e+00 |
| 2 |
-0.090130 |
-5.551115e-16 |
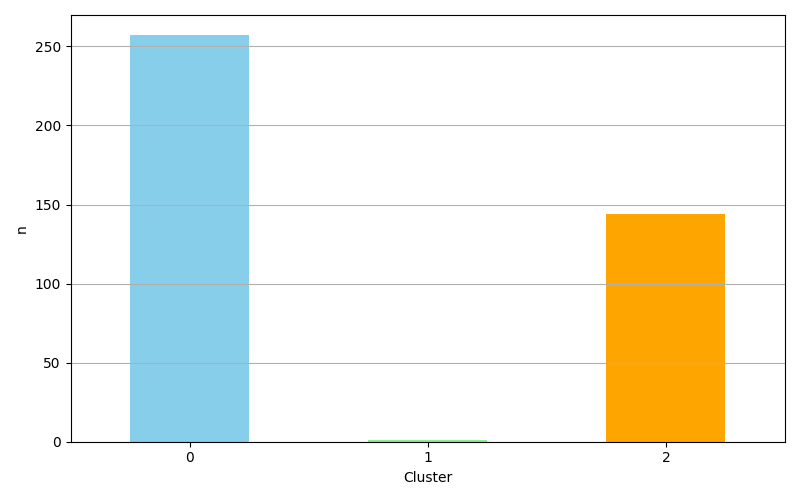
📉 Number of data in each group
| count |
Cluster |
| 0 |
257 |
| 1 |
1 |
| 2 |
144 |
📝 Cluster description:
- Cluster 0: Low income and low support (รายได้ต่ำและการได้รับการสนับสนุนต่ำ)
- Cluster 1: High income and high support (รายได้สูงและได้รับการสนับสนุนสูง)
- Cluster 2: Moderate income and support (รายได้และการสนับสนุนอยู่ในระดับปานกลาง)
📌 Data distribution graph
📊 Bar graphs show the amount of data in each group.